A little bit about me and Hologen!
I’m Sneha Das, a 2nd year Doctoral Researcher in Bioinformatics at the University of Turku, in the Turku Data Science group, pursuing my PhD as part of the Hologen Doctoral Network - Hologen, for short.
So what is Hologen? The name comes from the biological term
“hologenomics,” and that’s where our story begins. Hologen is a network of doctoral students and supervisors researching hologenomics and developing methods to analyze hologenomics datasets, with the broader goal of improving human health and deepening our understanding of host-microbe interactions.
Before I go further, consider this: your body is home to trillions of microbial cells, each with their own unique genetics- making you more microbe than human! Studying these microbes, and how they shape our health, is central to both the Hologen network’s mission and my own PhD project.
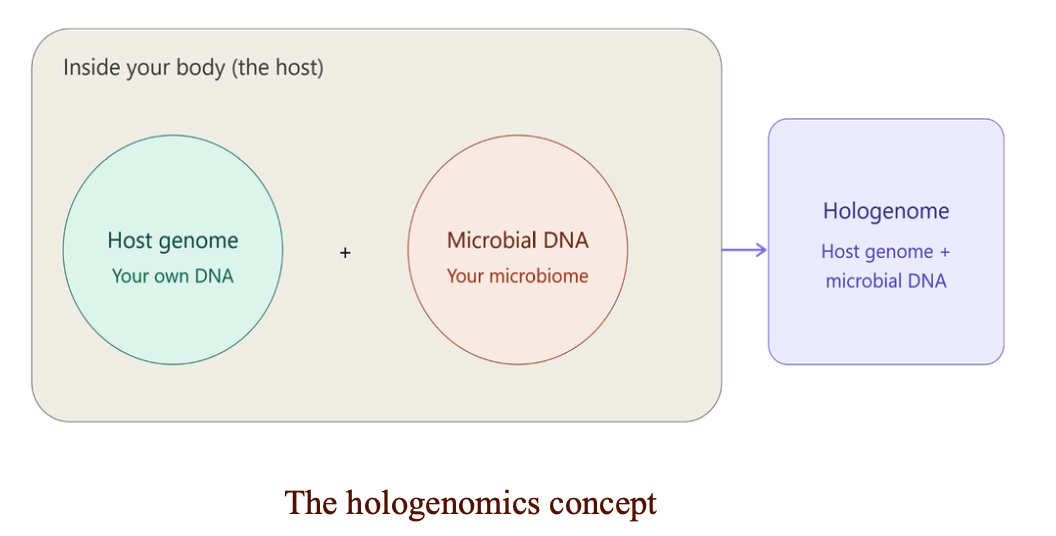
Hologenomics
So what is Hologenomics? It is the study of your DNA together with the DNA of all the microbes living inside you- not as two separate things, but as one connected whole. Think of your body like an apartment: you’re the main tenant, but you’ve got millions of microbe roommates living there too- some help keep things running smoothly, boosting your health, while others cause trouble and work against it. To really understand the apartment, you have to study everyone in it, not just you. That’s hologenomics: you and your microbe roommates studied together. This collective community of microorganisms living inside a host is called the microbiome.
To be biologically precise, hologenomics is a branch of “omics” (the large-scale analysis of biological molecules) that studies, as a whole, the genome of an organism and the genomes of all microorganisms residing in it.
It’s also interesting that hologenomics isn’t limited to humans- it applies to every living organism, from plants to animals, that acts as a host for microorganisms.
My PhD Project and some basics
My PhD project is titled “Multi-domain data integration for microbiome-based disease risk prediction.” In plain terms, it’s about mixing different types of data from different sources- what researchers call “multi-domain” data. Think about the various types of data in the real world: image, text, audio, and so on. Combining these instead of relying on just one gives a much richer picture. Say I want to understand your personality- I could look at your Spotify playlist, but that only tells me your music taste. Add to this your Instagram activity, and combining it all gives me a far more complete picture than any single source alone. It’s the same idea with health: different clues together help us predict risk better than any one clue on its own.
My PhD is modelled on this same idea- combining different biological data types from the same set of patients helps better diagnose and predict disease, rather than relying on just one data type.
These are “omics” data types: genomics, derived from DNA- the instruction book that makes us who we are; proteomics, the study of proteins- the workers that carry out the instructions; and metabolomics, the study of metabolites- the leftovers of all the biochemical processes happening inside us. Combined, these are referred to as multi-omics, or in statistical terms, multi-domain datasets.
In my project, I integrate metagenomics data from the human gut microbiome with metabolomics data from the same participants. Metagenomics, similar in spirit to hologenomics, is the study of all microbial genetic material isolated from a host environment, with host DNA removed to focus only on microbial DNA. Interestingly, metagenomics isn’t limited to living hosts, but it applies to any environment, be it soil, a freshwater lake, or a polluted one. In my PhD, I work specifically with human gut metagenomics- all the DNA of microbes present in your gut.
The human gut is our digestive tract- spanning the stomach and intestines - responsible for breaking down food, absorbing nutrients, and housing the vast majority of our body’s microbes. These are the ones behind our “gut feeling,” why we feel gassy and bloated, and why yogurt aids digestion: we’re essentially taking in Lactobacillus, a good bacterium that keeps our gut healthy. And it doesn’t stop at digestion- your gut microbes can influence your energy, your mood, even your sports performance. Basically, if you want to perform your best, on the field or in life, you’ve got to keep your gut squad happy
And, why does metagenomics matter? Think about how profoundly microbes affect us — we all remember COVID-19, how a virus invisible to the naked eye wreaked global havoc. Not every microbe can be grown in a lab, which is where sequencers come in — machines that fragment metagenomic samples and decode them into biological code. In simple terms, we read tiny pieces of DNA like barcodes to figure out which microbes are there. Computational tools then analyze those fragments and identify which microbes they belong to.
Survival Modelling- a very important part of my work
So I combine metabolomics and metagenomics data- but what do I actually do with it? Three keywords sum up my work: survival modelling, multi-omics, and the human microbiome.
Along with the microbiome data, I also track “survival data”: how long someone stayed healthy before a specific event happened- like developing a disease (for example, diabetes onset), or even death due to some cause (lets say for example cancer).
Here’s a simple example. Say I follow 3 people for 10 years, starting in 2000:
- Patient A died of cancer in 2005- survival time: 5 years.
- Patient B stays healthy all the way to 2010, so we simply don’t know what happens after — this is called “censored.”
- Patient C dropped out of the study in 2007 and we lost contact — also censored, for the same reason: we don’t know the ending yet.
By combining survival data with microbiome data, I can better predict when someone might get sick, and understand what’s happening in their gut that could explain why.
Survival modelling is the statistical technique that makes this possible — predicting when events happen, and tracking how many people are still “at risk” over time.
Multi-omics Fusion Strategies and Machine Learning
Now we have multi-omics data, as well as survival data, but with such heterogeneous and non-uniform data, how do we meaningfully combine these different sources? Because, as the golden rule goes, one size does not fit all. Consider a simple example: we have categorical data- like gender (male/female), or a yes/no questionnaire, while on the other hand we have continuous data, like age, height, weight, or BMI (Body Mass Index), which can take many different values. Can we use the same formula to analyse all of these? Can we treat them all the same? No- each data type needs to be processed differently using models that account for its inherent characteristics. Now add another layer of complexity: biological omics data, with its own nuances, where extra caution is needed before making predictions about someone’s health.
What exactly do we take from the metabolomics and metagenomics datasets? Abundance profiles: matrices listing the names of all the microbes or metabolites present in a sample alongside their abundances (how many of each were found), for metagenomics and metabolomics profile respectively. Crucially, both datasets must come from the same set of participants.
We then integrate these datasets using machine learning models, trying out different ways to combine them, better known as fusion strategies:
Early fusion- we simply combine the two datasets exactly as they are and feed them into the model together, just to see the outcomes. It’s the simplest approach.
Late fusion- each dataset is trained completely separately, and only their final predictions are combined to give the overall output.
Intermediate fusion- each data type is first processed in a way that suits its unique characteristics, and then combined at a chosen point. This sits between early and late fusion, and is often the best-suited method for this kind of analysis.
So which one usually works best? Often intermediate fusion- because it treats each data type fairly, letting it “speak its own language” first before combining everything, rather than forcing all the data into one mold too early or too late.
In terms of machine learning algorithms, we have been testing multiple options to eventually finalise the most optimal ones to release publicly. One well-known and easy to understand example of one of the algorithms tested is Random Forest Survival. Random Forest is based on decision trees- and here’s a simple way to picture it. Imagine you have a list of movies for movie night and need to pick one. You ask a friend a set of questions based on their movie preferences. But asking just one friend may give you a biased or partial opinion. So instead, you ask many different friends the same questions, and the movie that gets the most votes is selected. A group of different voices leads to a more balanced and reliable decision. That’s the core logic of Random Forest- each “friend” is like a mini-model, and in our case, they’re all voting on things like how a person’s microbiome relates to their disease risk.
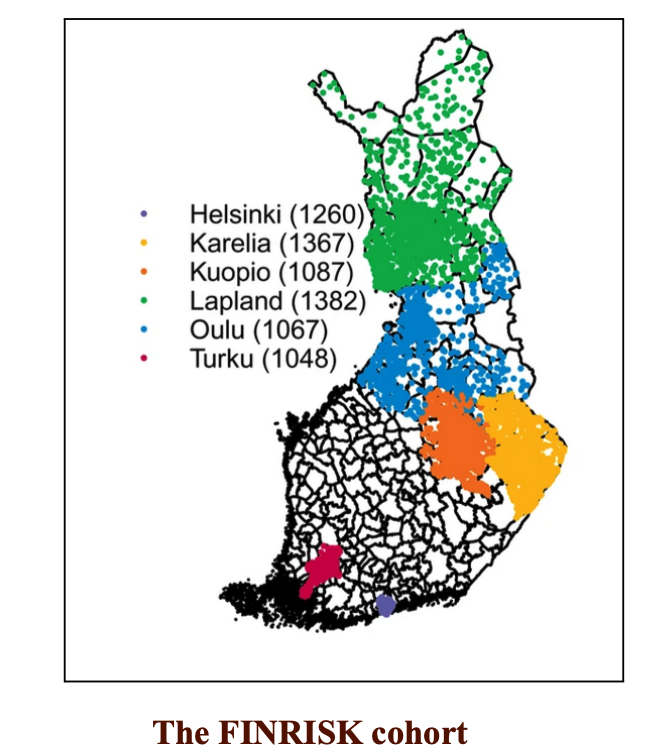
The Data and the Tool
To train and validate our models, we use the FINRISK dataset [1,2], a unique and well-characterised cohort of Finnish people sampled from all across Finland, with rich metadata and survival data spanning many disease endpoints as well as all-cause mortality. We currently have over 20 years of follow-up data for over 7,000 participants, making it an exceptionally large and high-quality cohort that gives us strong confidence in our predictions. The bigger the dataset, the more reliable the patterns we find- think of it like a school poll. If you only ask 5 students what their favorite subject is, you might get a biased answer. But if you ask 100 students across every grade, the results actually reflect the whole school. We are also testing various parameter combinations, running models on the full dataset as well as subsets, on raw data as well as filtered and screened data, accounting for the inherent characteristics of the data and performing preprocessing to reduce variance (simply put, how much the data is inconsistent and scattered).
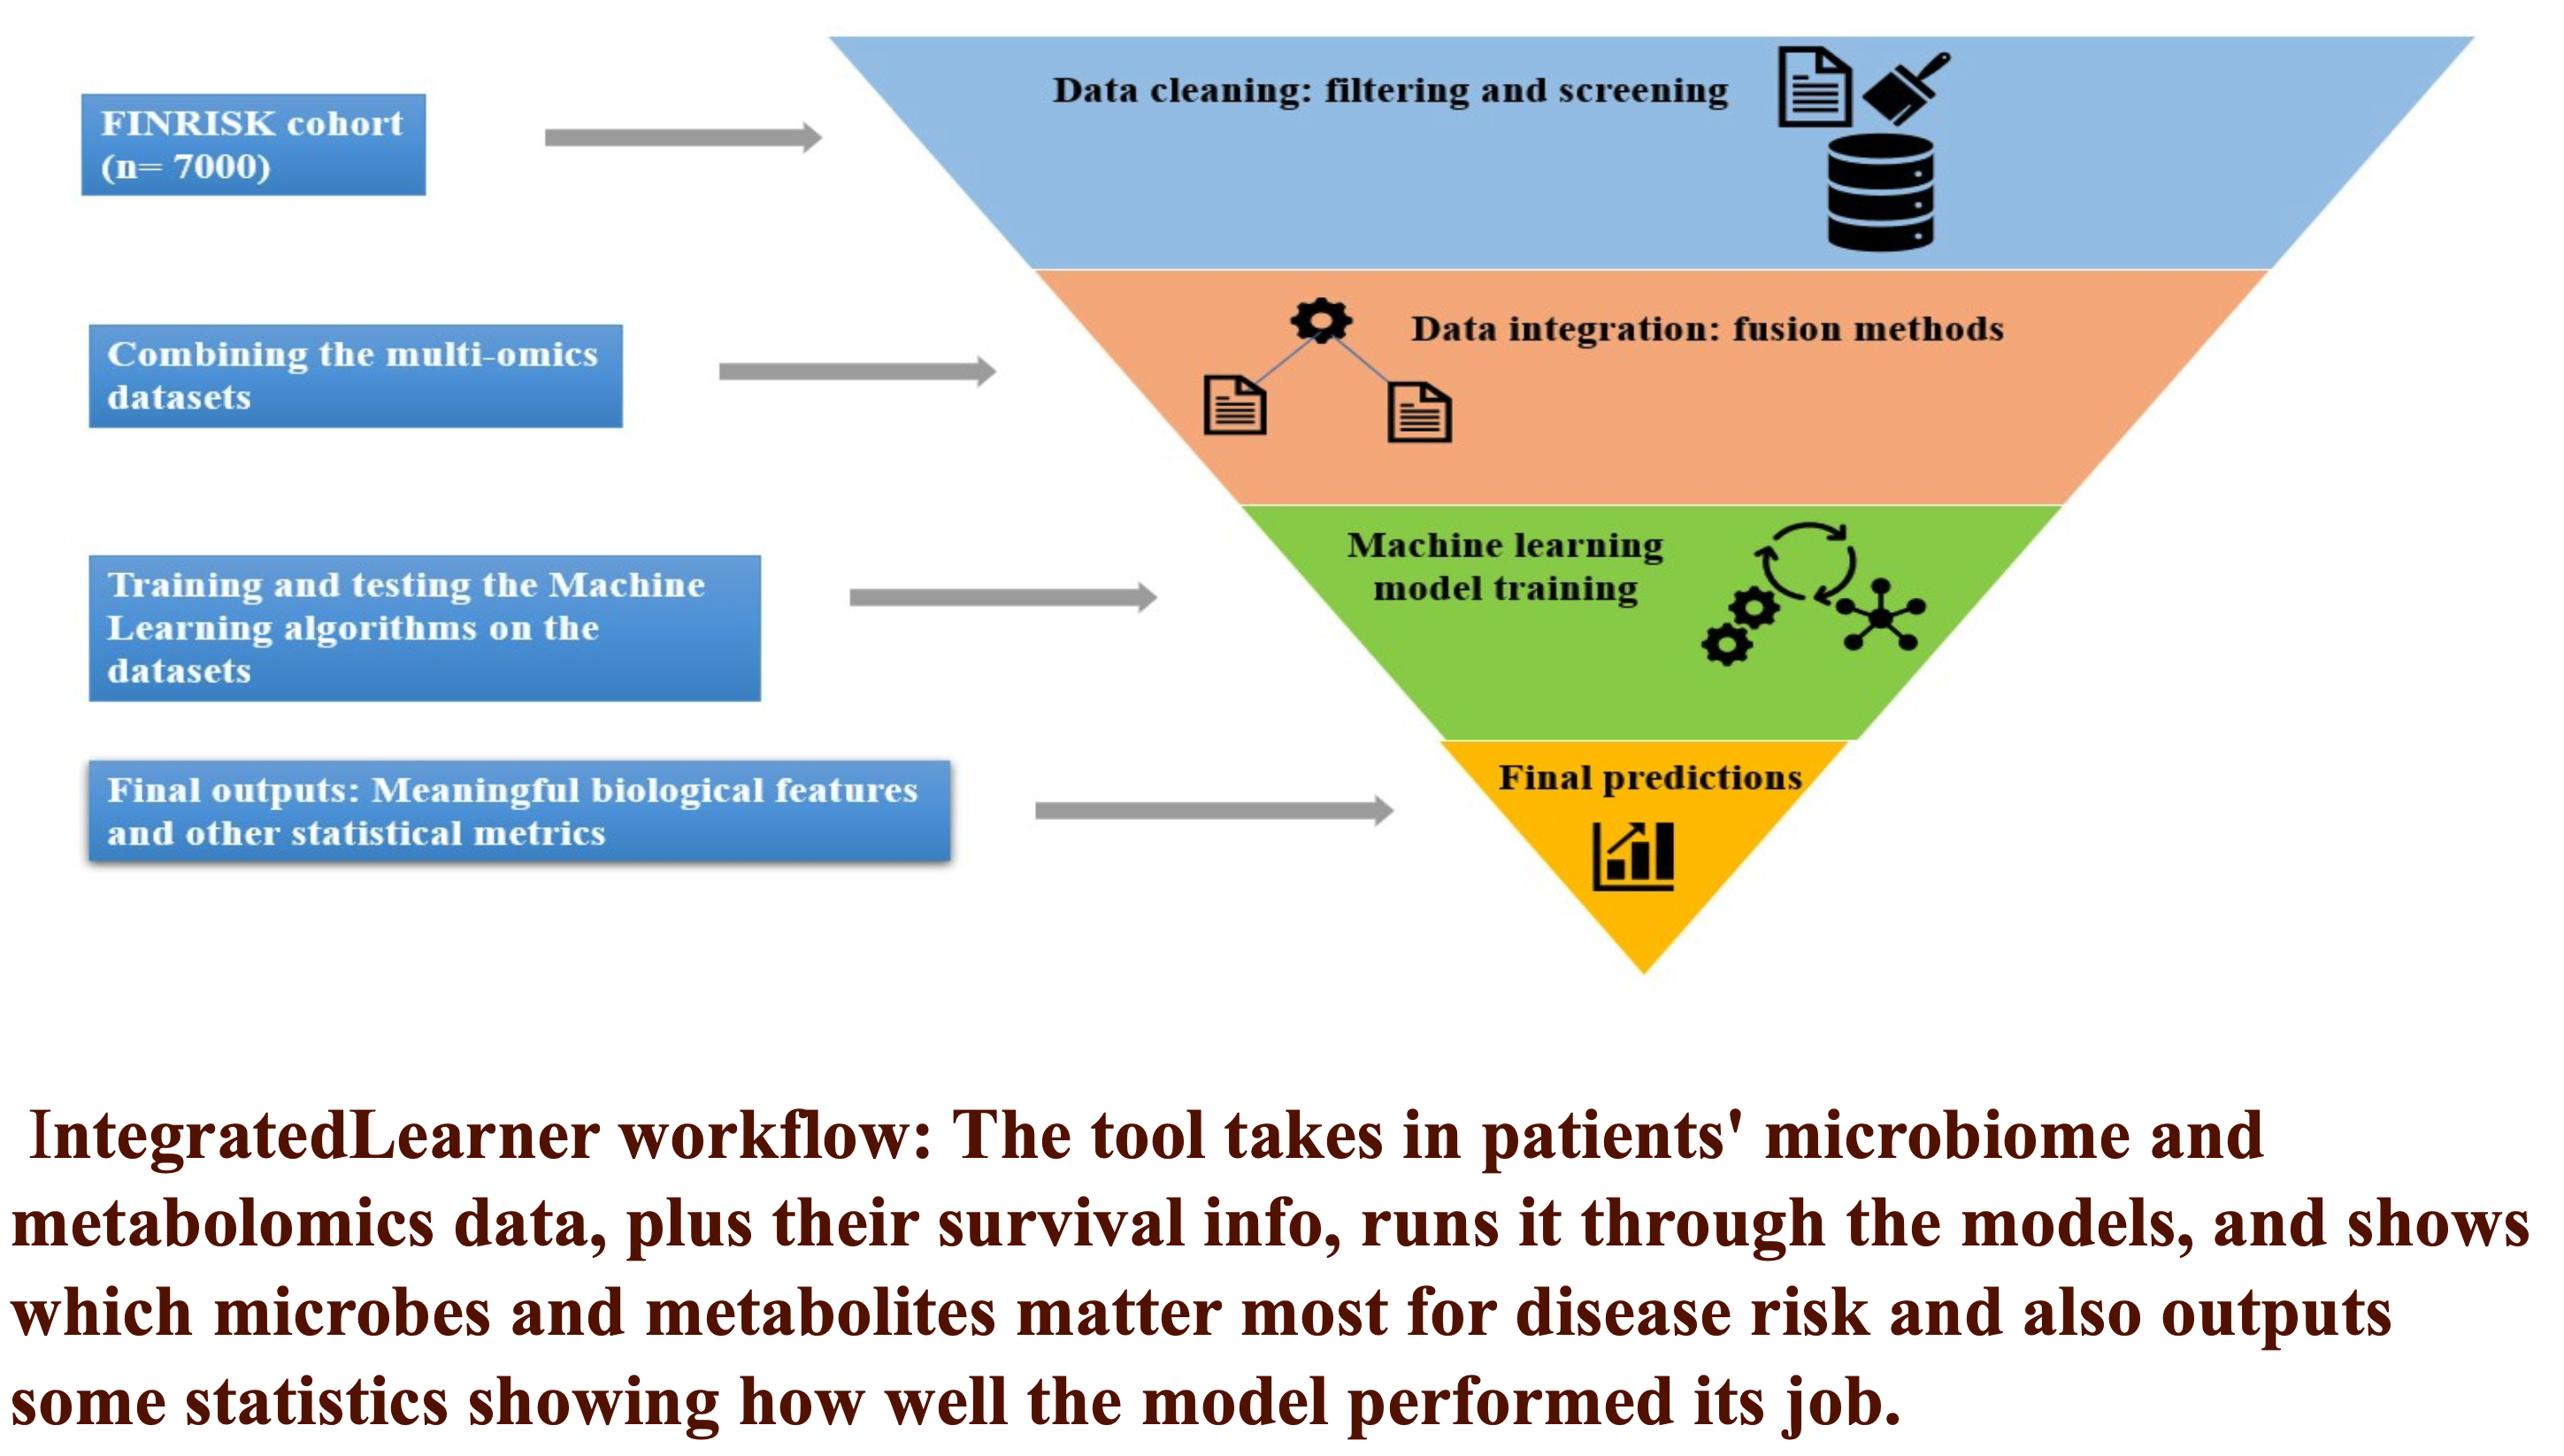
The computational tool we use and extend is IntegratedLearner [3,4], available as an R package on GitHub. Originally built for multi-omics classification, my project extends it to incorporate survival analysis, adding functions for survival data integration. The final output is not just survival predictions and evaluations of how good those predictions are, but also meaningful biological signals: the top features driving or associated with the survival outcomes, for example, the top bacteria or top metabolites most strongly linked to the disease endpoint of interest.
Collaborations
This work is done in close collaboration with Himel Mallick’s team, who originally developed IntegratedLearner. I am deeply grateful to my supervisors, Leo Lahti and Aki Havulinna for their constant support, to our collaborator Himel Mallick and Nalin Arora from his team, for their invaluable guidance, contributions, and support throughout this project. Day to day, that looks like Zoom calls across time zones, sharing codes and outputs, and comparing results back and forth until things click. Because as they say, if you want to go fast, go alone; but if you want to go far, go together. This collaboration lets us bring our complementary skillsets to the table, get mentored by amazing supervisors, learn from each other, and ultimately give a meaningful and useful tool back to the community.
R and Bioconductor: the essential toolbox for the biological data scientists!
For my work, I rely heavily on R, a coding language used to analyze data, along with Bioconductor packages like mia, a toolkit built specifically for microbiome analysis. These are some of the tools scientists use to make sense of biological data. And to future bioinformatics enthusiasts: I highly recommend googling these up
Summing up my PhD journey so far
There are honestly a million things that excite me about this PhD: the cultural exposure as an international student, the collaborations across labs and continents, the chance to hone my skills and learn cool new science, and most importantly, the opportunity to contribute something back to the scientific community and beyond, something that could genuinely be used for the betterment of human health.
If there’s one thing I want you to take away from this, it’s simple: be curious, follow what you’re passionate about, and just go for it. Along the way, you’ll find amazing mentors and incredible projects to work on. For me, that passion turned into a wish to do something related to the betterment of human health- I hope you find yours too. On the scientific side, I highly encourage you to look up gut microbes and why they’re so important to your health!
I hope I’ve managed to inspire some curiosity about science through this blog, and thank you so much for reading! This was all about my work, but there’s so much more to a PhD- retreats, conferences, work trips, seminars, presentations, making scientific connections and friends, and if you want to know more about my exciting PhD life, stay tuned for my next blog!
References
- Salosensaari, A., Laitinen, V., Havulinna, A. S., Meric, G., Cheng, S., Perola, M., Valsta, L., Alfthan, G., Inouye, M., Watrous, J. D., Long, T., Salido, R. A., Sanders, K., Brennan, C., Humphrey, G. C., Sanders, J. G., Jain, M., Jousilahti, P., Salomaa, V., Knight, R., … Niiranen, T. (2021). Taxonomic signatures of cause-specific mortality risk in human gut microbiome. Nature communications, 12(1), 2671 https://doi.org/10.1038/s41467-021-22962-y
- Borodulin K, Tolonen H, Jousilahti P, Jula A, Juolevi A, Koskinen S, Kuulasmaa K, Laatikainen T, Männistö S, Peltonen M, Perola M, Puska P, Salomaa V, Sundvall J, Virtanen SM, Vartiainen E. Cohort Profile: The National FINRISK Study. Int J Epidemiol. 2018 Jun 1;47(3):696-696i. doi: 10.1093/ije/dyx239. PMID: 29165699.
- Mallick, H., Porwal, A., Saha, S., Basak, P., Svetnik, V., & Paul, E. (2024). An integrated Bayesian framework for multi-omics prediction and classification. Statistics in medicine, 43(5), 983–1002. [https://doi.org/10.1002/sim.9953 (https://doi.org/10.1002/sim.9953)
- [https://github.com/himelmallick/IntegratedLearner (https://github.com/himelmallick/IntegratedLearner)
