The tools used to read the DNA code have become very good in the past decade, so good in fact that scientists are able to detect thousands of different species of microbes based solely on short chains of letters that they are able to extract from an environment. This type of DNA characterization is called metagenomics, colloquially known as the analysis of DNA fingerprints, and in the field of human health, it allows us to discover a new world inside the human gut. The organisms there compromise many different species, which also vary significantly across different human populations, and these differences are also correlated with variations in dietary habits, sex differences (male/female), age and, most importantly, health issues.
The gut microbiome generates many metabolic products that can affect the human body locally, like with IBS or lactose intolerance, or even generally, through the two-way communication pathways that exist between all of our organs. There is growing evidence of a correlation between the gut microbiome and bone health, mental health, and cardiovascular health. However, correlation does not imply causation, sunburns and numbers of ice cream sales rise in the summer, but ice cream doesn’t cause sunburn, so what exactly is the link between the composition of a particular gut microbiome and certain health problems? My PhD project focuses on trying to find out the answer to this question using maps, geography and statistics data.
The study of geographical patterns to understand the underlying causes of diseases is nothing new, John Snow in 1854 was able to discover the cause of a Cholera epidemic in London by counting the number of cases surrounding a water pump in Broad Street. It was one of the first examples of data mapping helping to solve a health crisis. This study was able to pinpoint that the cause of the disease was coming from the water contaminated with sewage and opened the way for the acceptance of the microbial theory of the disease against the more commonly held belief in “bad airs” called miasma.
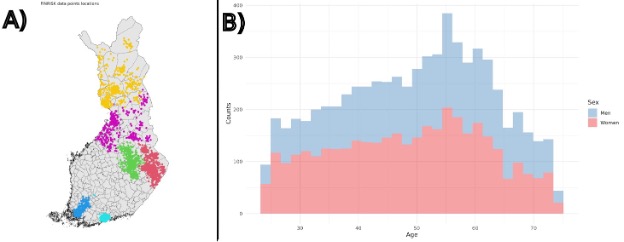
In my project, I try to do a similar type of investigation using data from the public health surveys of Finland to find geographical patterns that reveal to us particular causes for the alterations found in the human gut microbiome. This data includes questionnaires about the patients health, economic status, dietary restrictions and patterns and, more importantly, it is accompanied by stool samples that were used to collect the microbial data. I expect matches between the distribution of certain health conditions and the presence of particular gut microbiome species, this way, I can evaluate more accurately the possible causes for such an effect. Finland possesses a very extensive survey of the Finnish population, and with this data we can explore all kinds of different relationships. More importantly for this project, the geography of Finland varies significantly in terms of latitude and degrees of urbanization, with a densely urbanized south and a sparsely populated northern region. This offers us a great opportunity to measure how regionally distinct dietary habits and environmental conditions shape the human gut microbiome. For example, rural environments have a tendency to consume less processed foods, and we can check whether this lower consumption affects the gut microbiome in some particular way.
The data, however, is very sparse, there are many cities and regions in Finland that do not possess sampling data, and because of that I have to use maths to better analyze how the human microbiome varies across space. The way this is done is by assuming that regions that are close by are more similar to one another than regions that are far apart. With this assumption I can make a guess about the data points across empty spaces. This is done by creating an interconnected graph across the territory of Finland that allows us to relate the characteristics of the geographical spaces with their immediate neighbors, like checking the 8 spaces around a king piece on a chessboard grid.
What was particularly interesting in these analyses is that, for many different bacterial species in the samples, there is a clear north/south divide in Finland in terms of gut microbiome composition; we don’t know exactly why this happens, but we are investigating. Moreover, the genus Prevotella specifically, which is correlated with diets richer in fibers and grains, has a notable relationship with the level of urbanization in Finland. This relationship is already known in the scientific community, and this is reassuring because it demonstrates that the dataset and the methods are working as expected! However, the main objective is to use this framework to uncover not yet known relationships.
By understanding how geographical patterns relate to the presence of certain gut microbiomes, Health institutions can then draw conclusions that could be used to design health policies that are more localized and could help with more directed approaches. If the cause of an unbalanced microbiome is very clear and pronounced (which is not always the case) then this approach could even be used to discover measurable signs in the body for gut diseases.
